Agents are background workers that Brightwave starts when you request a structured output. Each agent reads your project's sources, performs analysis, and delivers a finished result that you can review, edit, and export.
How agents work
When you send a message that requires a structured output, Brightwave starts one or more agents to handle the work. Agents run in the background, so you can continue your chat or switch to another task while they execute. Expand the research process panel to follow an agent's progress in real time.
Agent status
Each agent moves through a lifecycle:
- Pending — queued and waiting to start.
- Running — actively processing your request.
- Needs input — paused and waiting for additional information. Click Continue to provide more context or let the agent proceed.
- Completed — finished; the output is ready for review.
- Review — completed but requires your approval or rejection before finalizing. If you don't act, the system will handle it automatically.
- Failed — encountered an error and could not finish. Click Retry to run the agent again.
Agent types
| Agent | Produces | Export formats |
|---|---|---|
| Report | Structured research reports with cited sections | Word (.docx), PDF |
| Document | Freeform Word documents, markdown, text, JSON, PDF, and images | Word (.docx), Markdown (.md), Text (.txt), JSON (.json), PDF (.pdf), PNG, JPEG, WEBP |
| Image | AI-generated images — diagrams, visual summaries, and illustrations | PNG |
| Presentation | PowerPoint slide decks | PowerPoint (.pptx), PDF |
| Spreadsheet | Excel workbooks and CSV files | Excel (.xlsx, .xlsm, .xls), CSV (.csv) |
| Chart | Interactive Plotly visualizations | PNG |
| Table | Structured data grids with citations | Excel (.xlsx) |
| Search | Synthesized findings with citations | — |
Reports
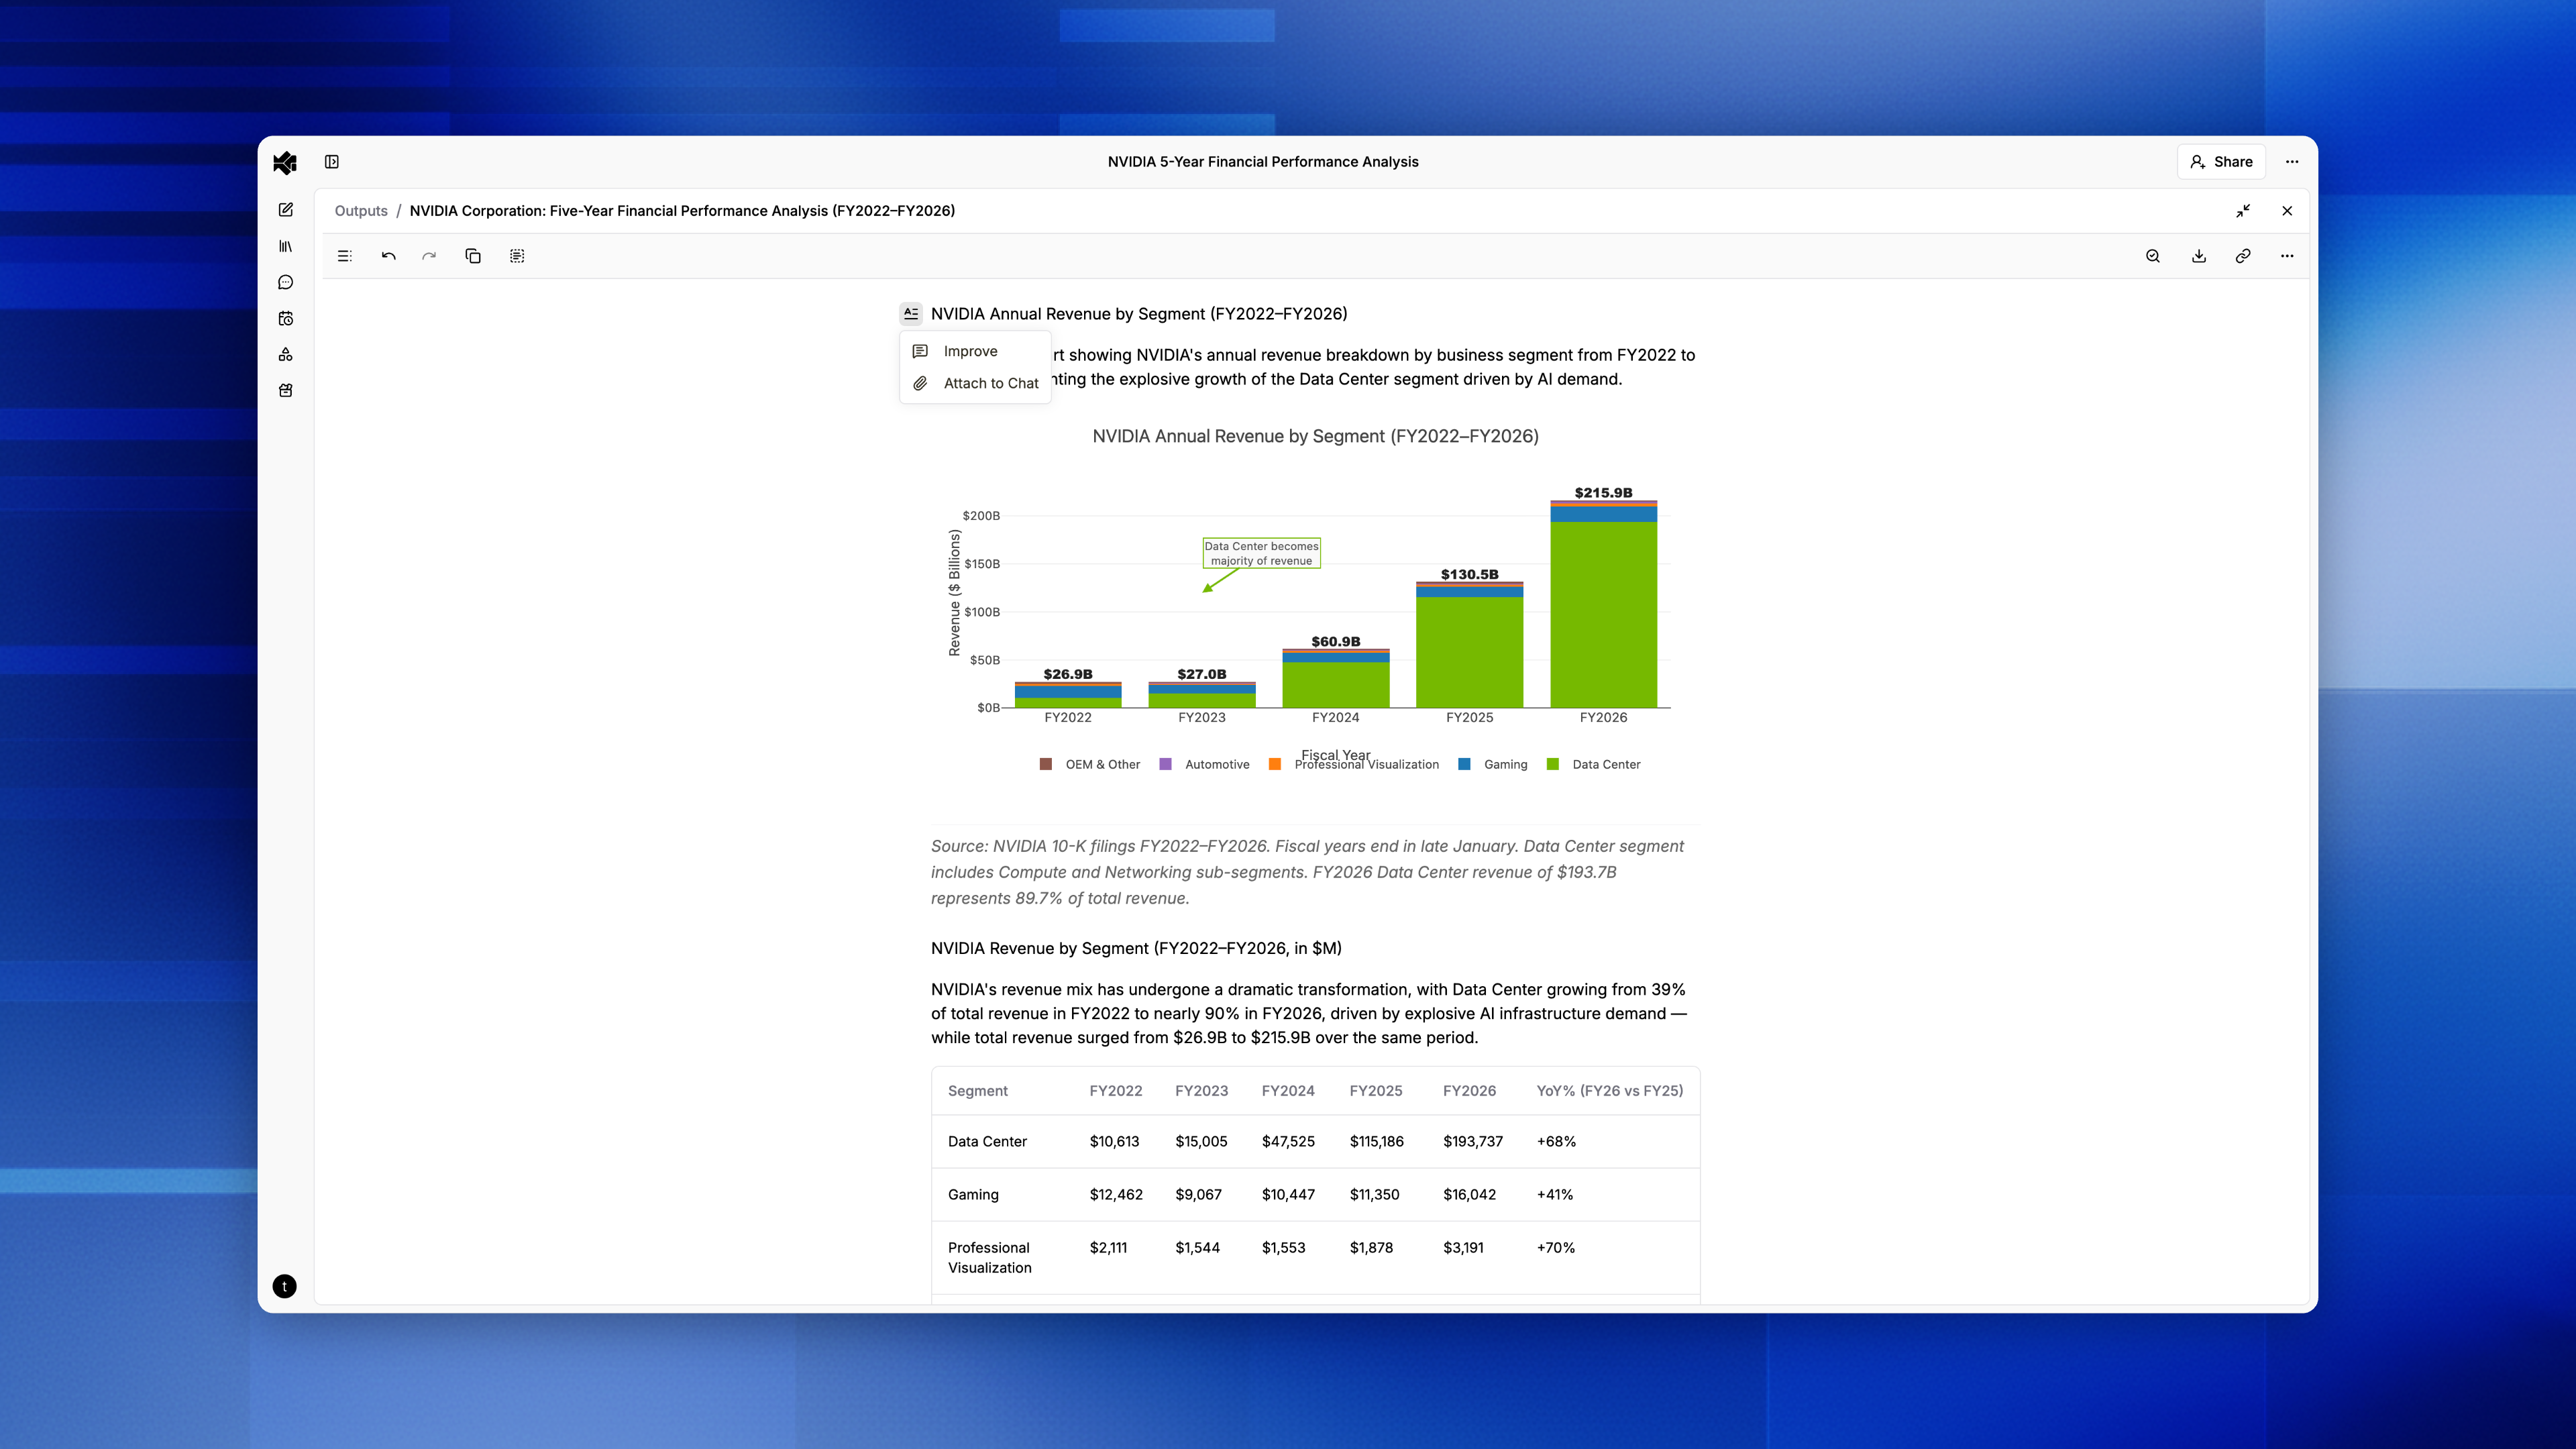
Reports are multi-section research documents with a table-of-contents sidebar. The report agent can start chart and table sub-agents automatically to embed visualizations within sections. Every claim is backed by a citation — click one to view the source passage in the document viewer.
To edit, hover over any section title — click Improve to refine text, or reorder and undo changes.
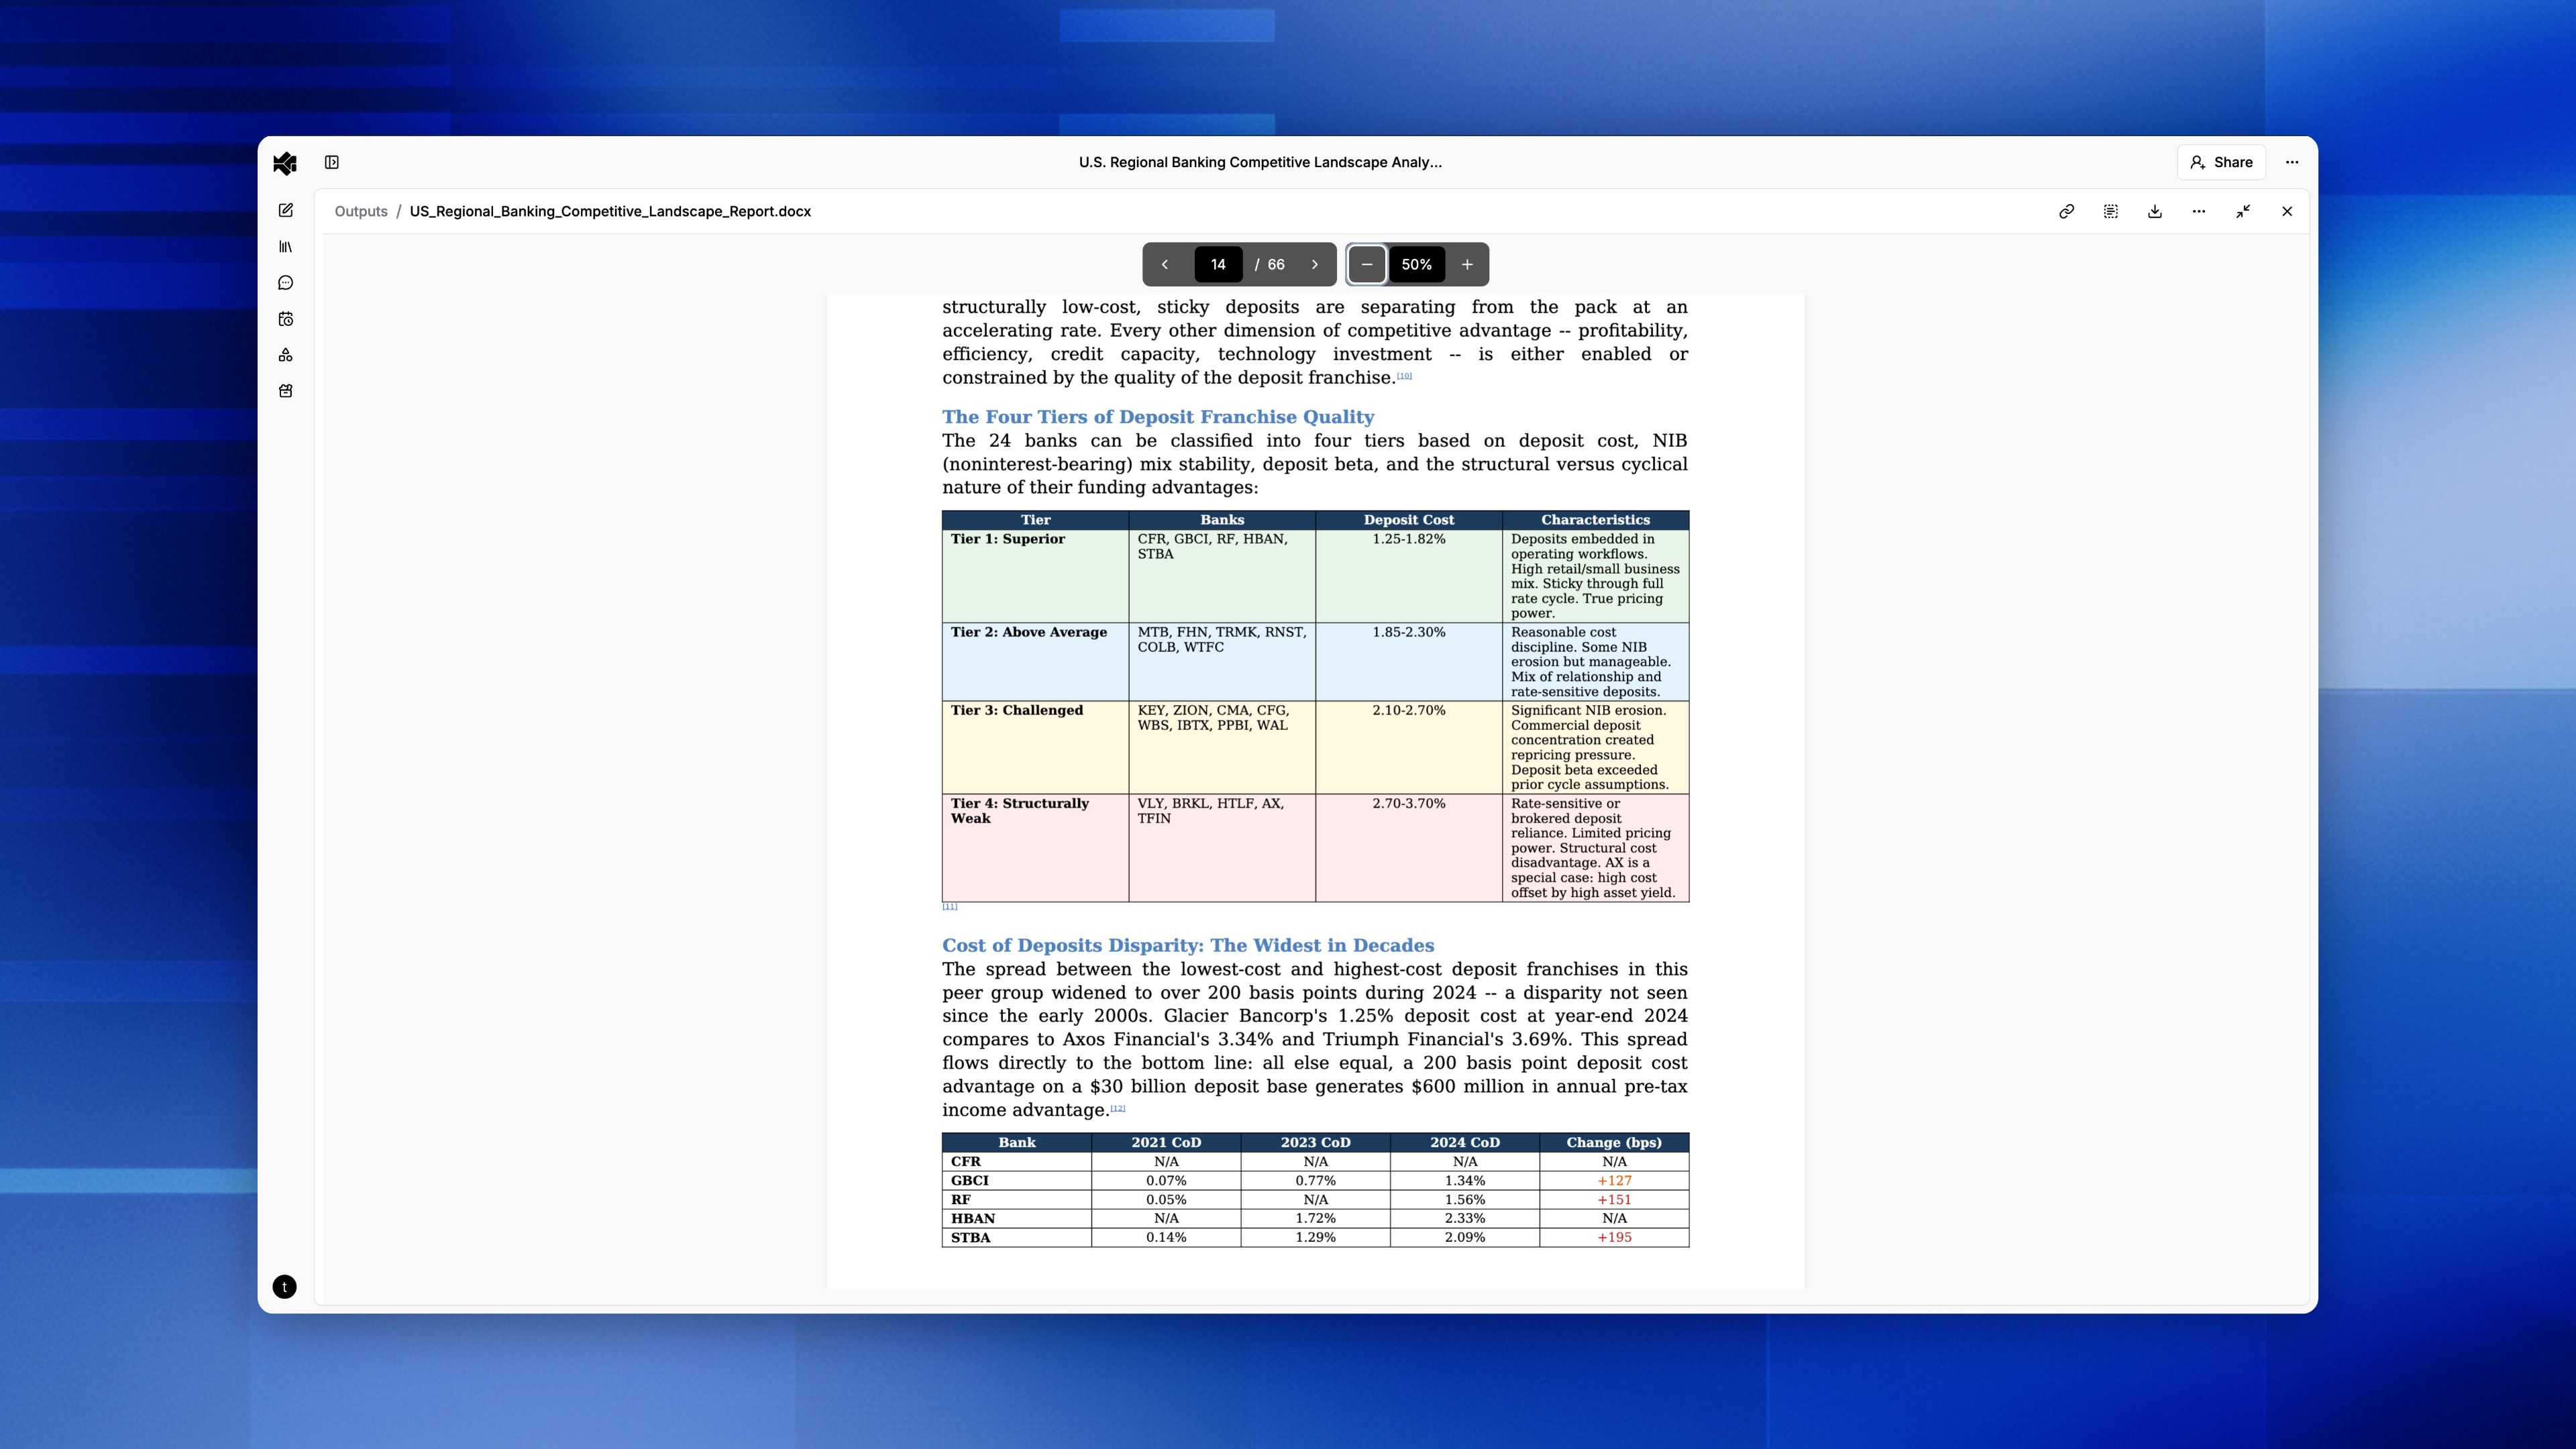
Documents
Documents are freeform written outputs — more flexible than reports, without a fixed section structure. The document agent will be used when you need a memo, summary, or any written content that doesn't require the rigid structure of a report. The agent can also output structured JSON documents when your workflow requires machine-readable data, generate PDFs when you need a polished, print-ready deliverable, or create images (PNG, JPEG, WEBP) such as diagrams or visual summaries.
Text and Markdown outputs are directly editable in the viewer — click into the document to make changes inline. Edits are tracked through version history.
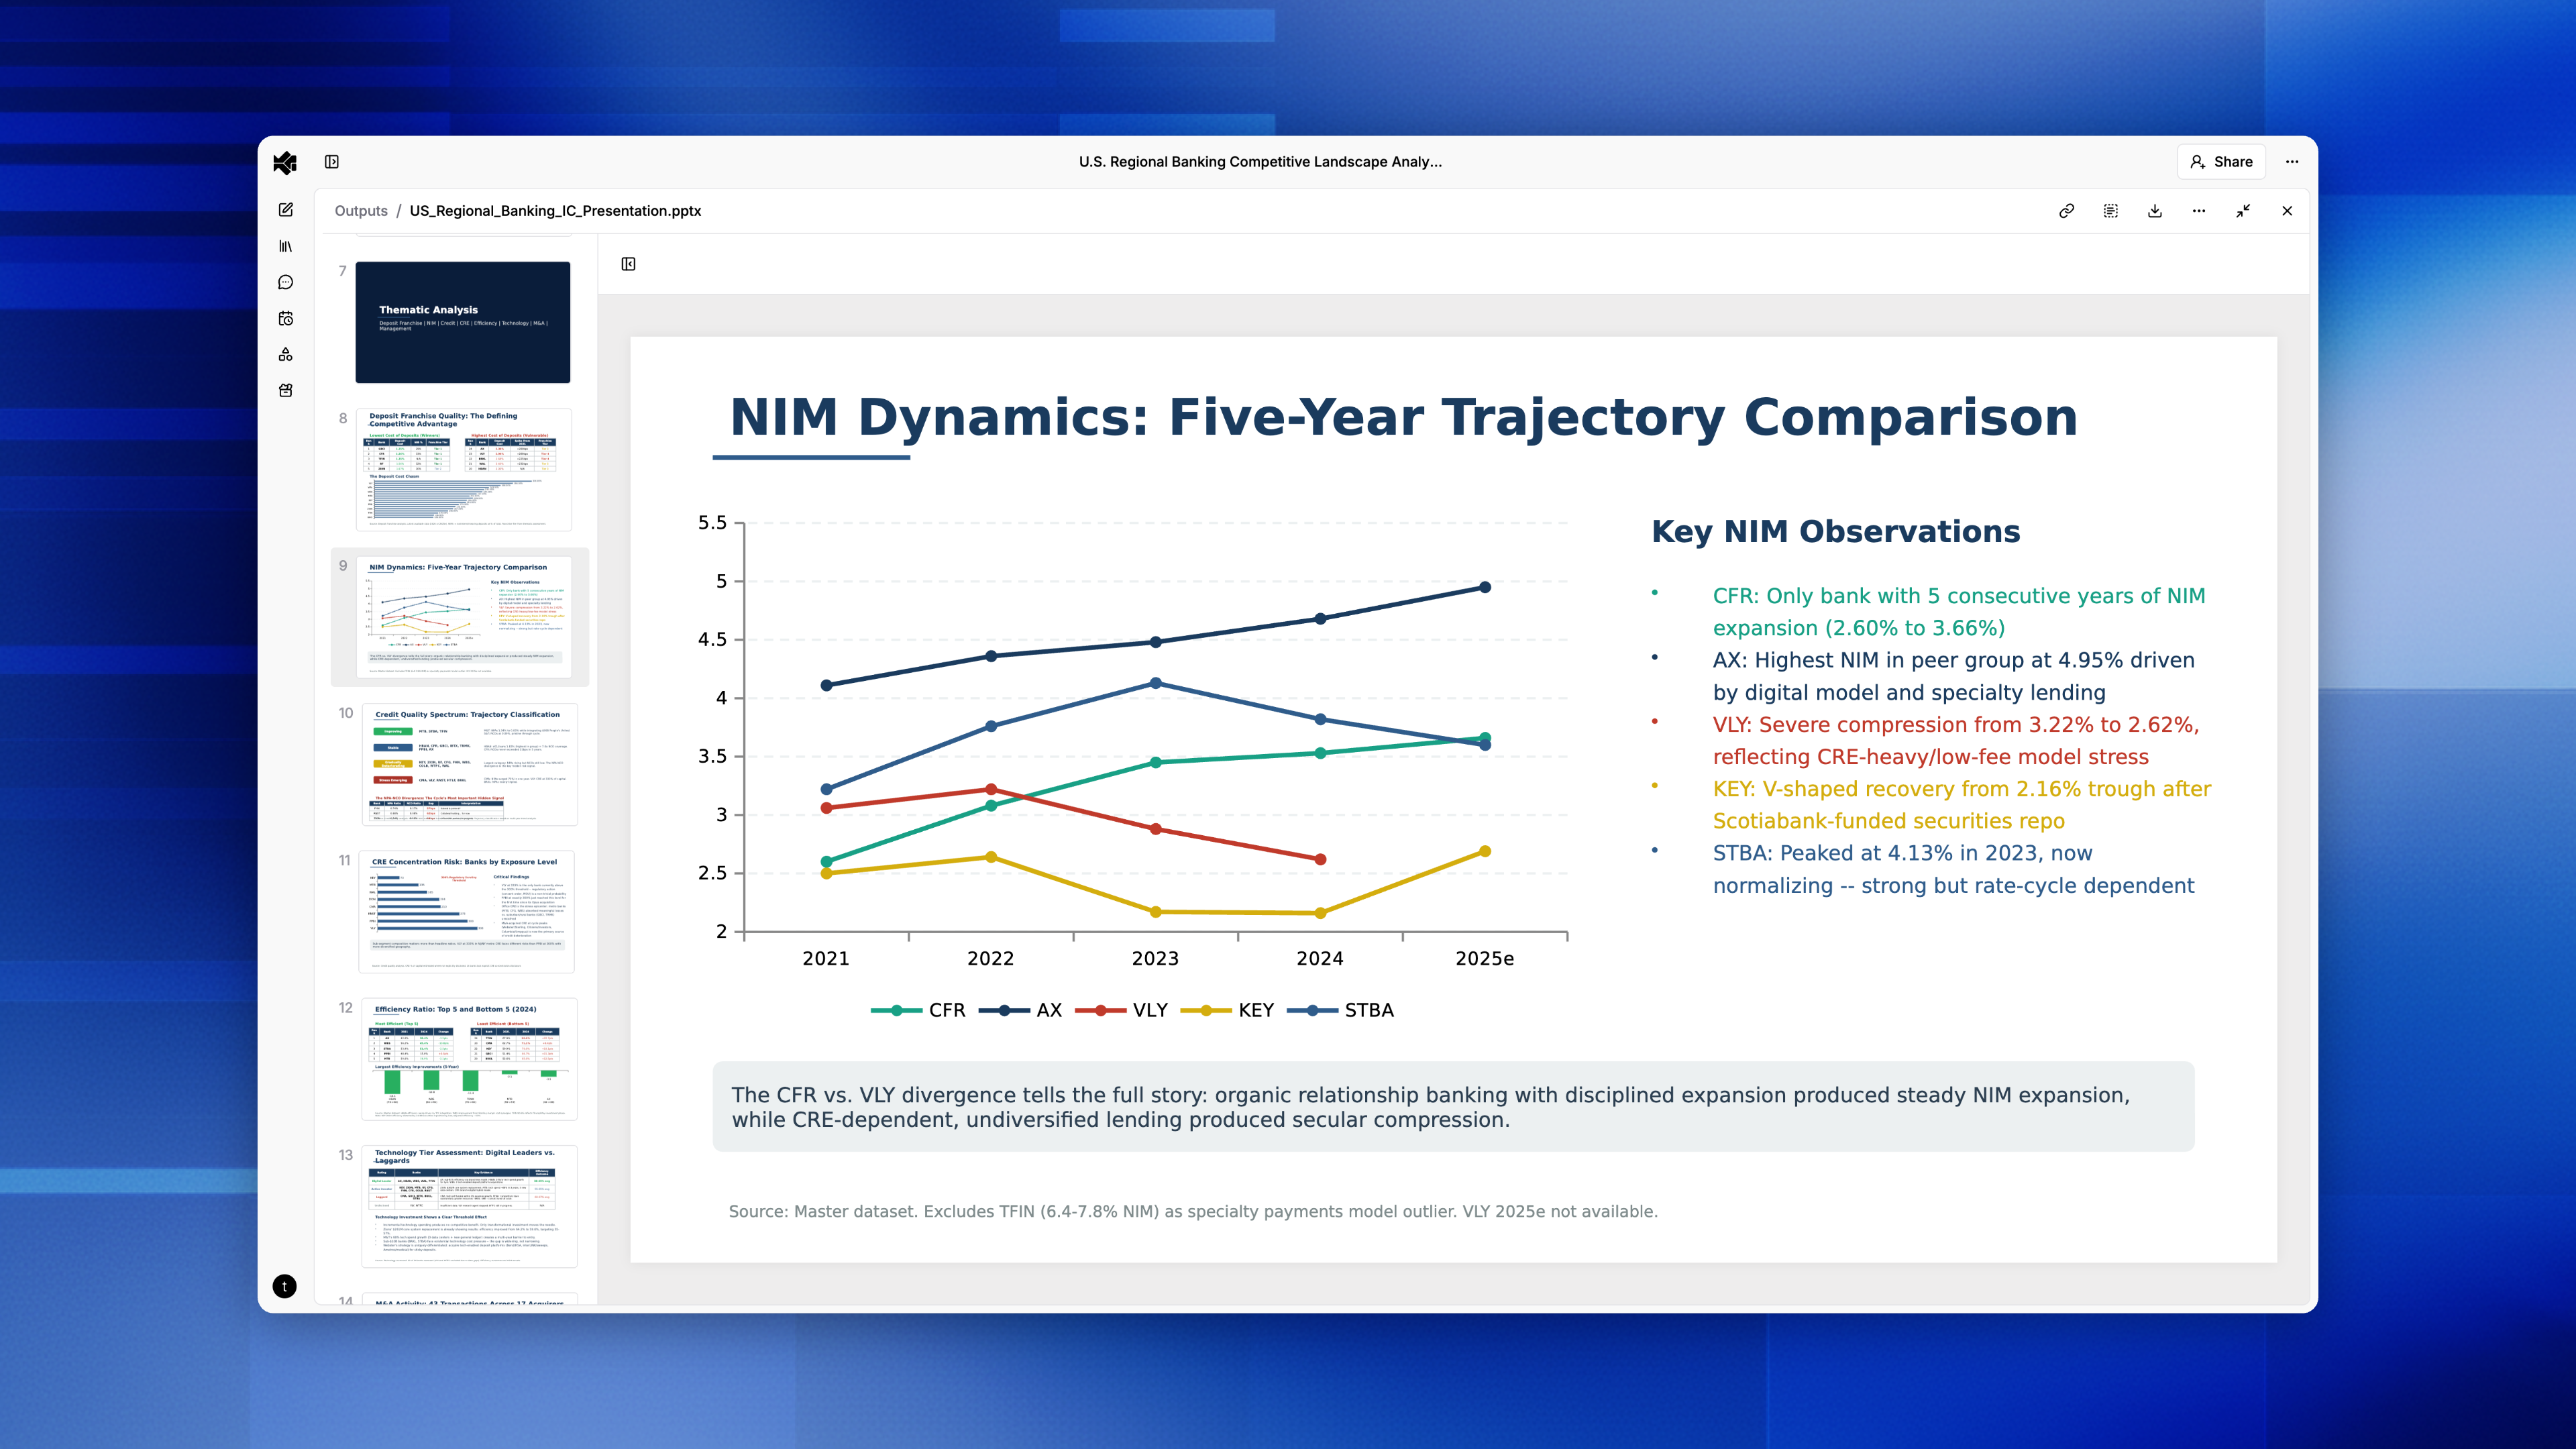
Presentations
Presentations are native PowerPoint decks. Browse slides in the viewer and click any slide to view it in detail. Apply a branded template before generating to match your company's style and layout. Citations appear below each slide — click one to jump to the source passage in the document viewer.
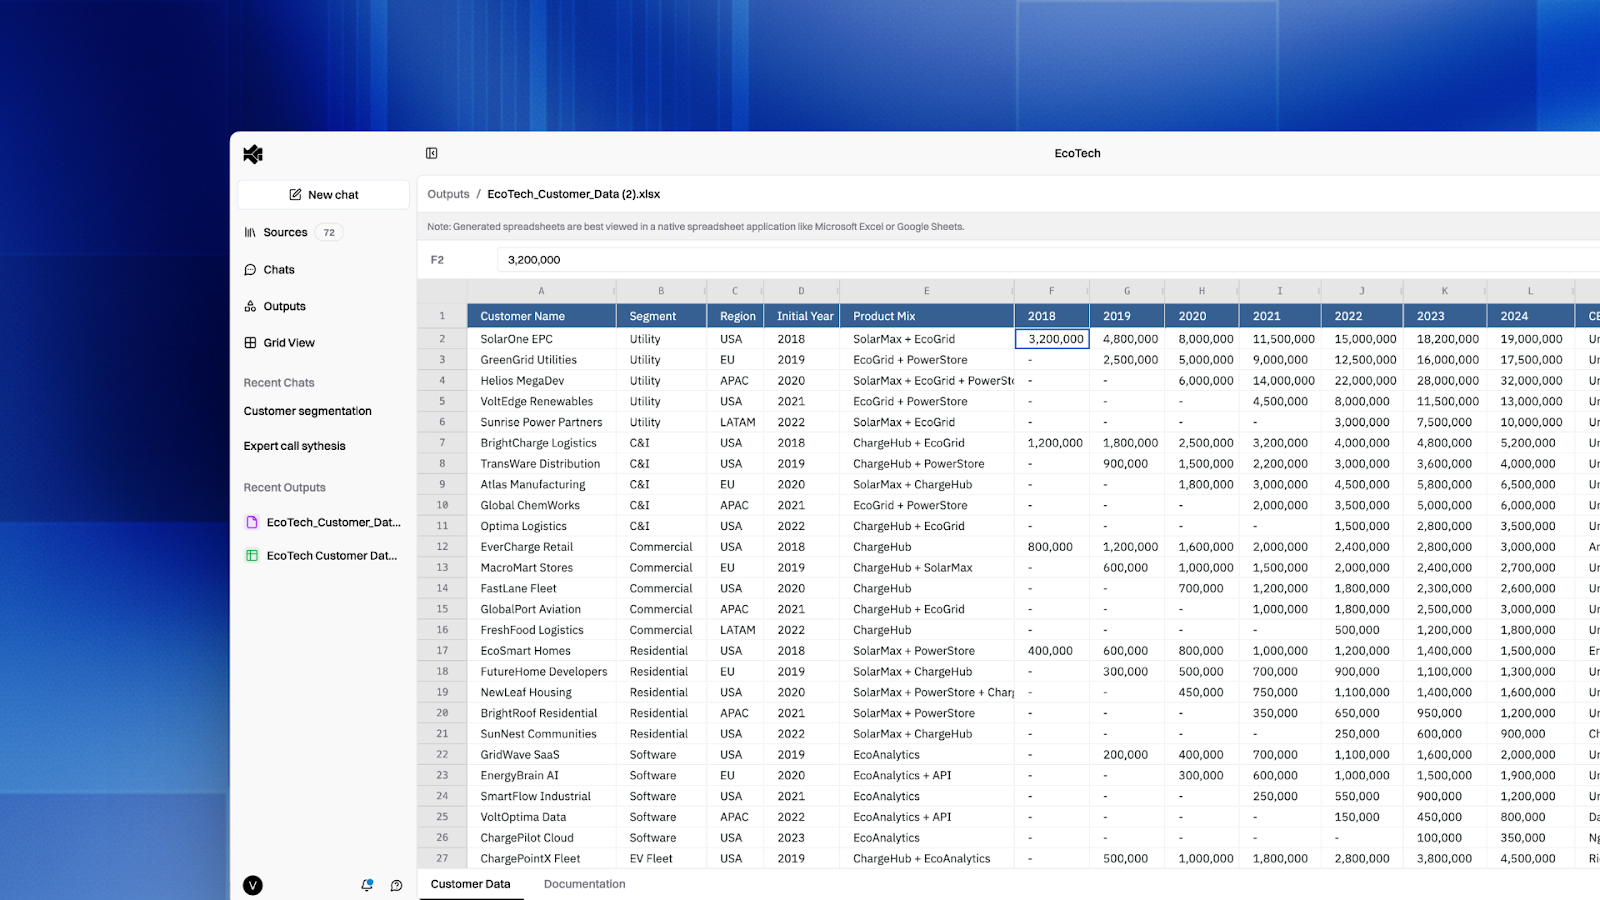
Spreadsheets
Spreadsheets are Excel workbooks or CSV files generated from your data. Provide an Excel template to define structure and formatting. Macro-enabled workbooks (.xlsm) and legacy Excel files (.xls) are also supported. Upload an XLSM template and the agent will preserve your macros in the output, or request CSV when you need a lightweight, portable format.
Spreadsheet outputs are directly editable in the viewer — click into any cell to make changes, adjust formatting, and rotate text. Edits are saved automatically and tracked through version history.
When an agent references specific cells, click the reference in the chat to focus the spreadsheet viewer on that cell range. Citations appear as Excel comments on cited cells — hover over the comment indicator to see the source reference, and click through to view the passage in the document viewer.
A shortcuts bar at the top of the spreadsheet viewer lists commonly used keyboard shortcuts. Click Shortcuts to see the full list, including trace precedents, redo, sheet tab switching, fill down/right, and autofit columns. Shortcuts display platform-appropriate keys for Mac and Windows.
Charts
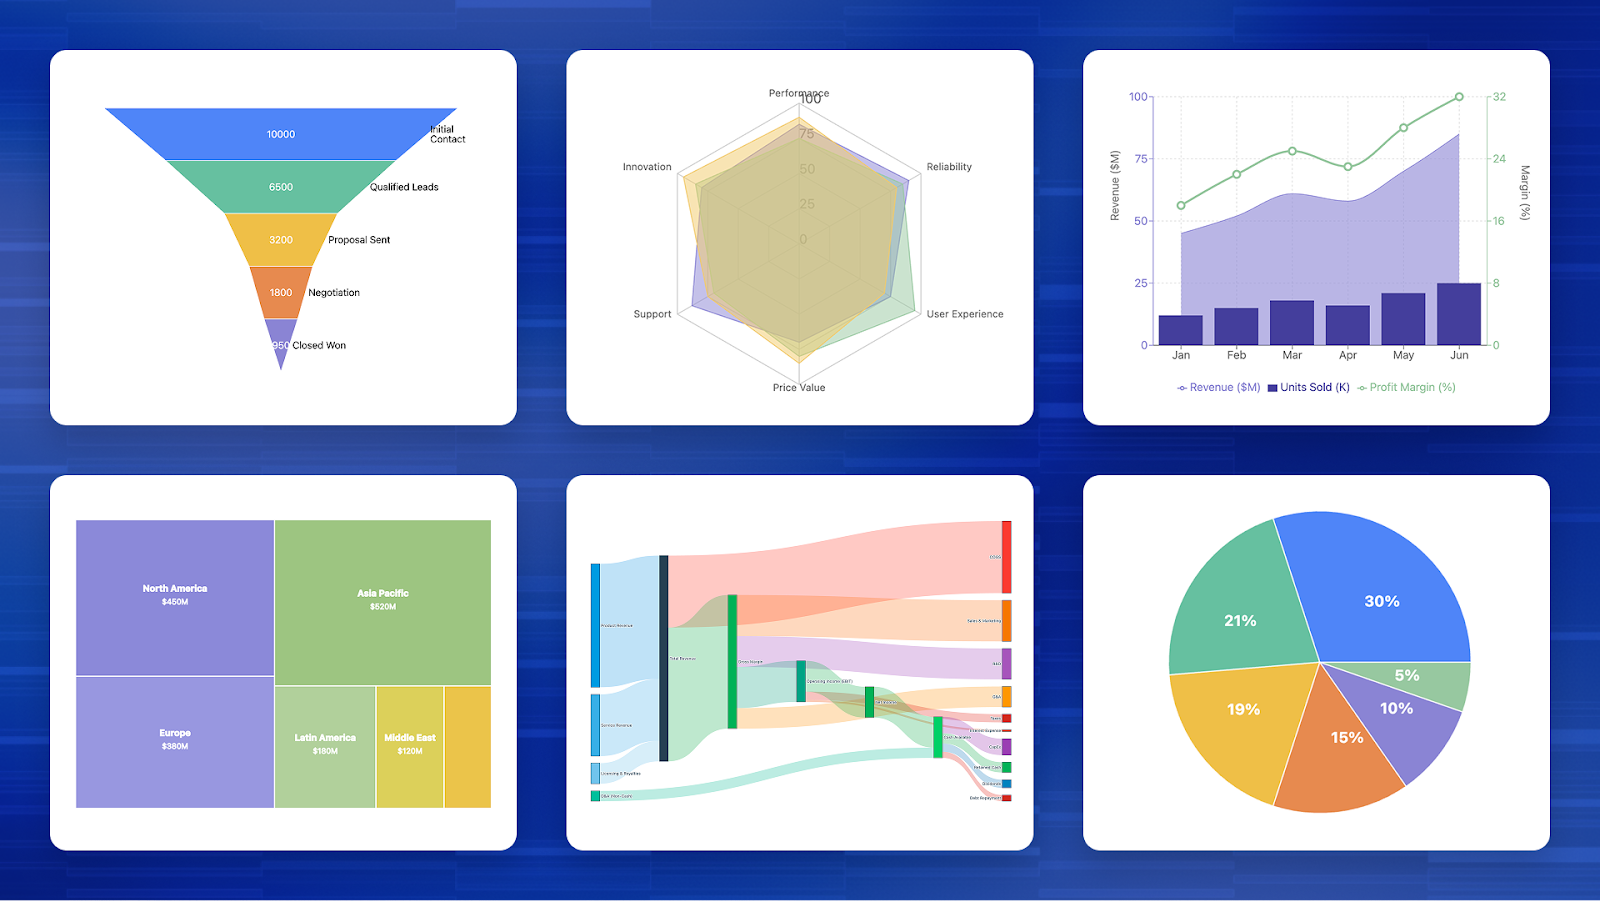
Charts are interactive Plotly visualizations. Hover for data points, zoom, and pan directly in the viewer. Supported types include bar, line, scatter, combo, stacked bar, and pie charts.
Tables
Tables present structured data with column headers, row headers, and cells. Each cell can include a citation traced to the source document. Export a single table or all tables from a chat as a combined workbook with multiple sheets.
Grids
Grids are N×M analysis matrices. Define your questions as columns and your documents as rows, and Brightwave fills every cell with cited findings. Add columns to an existing grid to expand your comparison without starting over.
Image generation
Agents can generate images on demand using AI image models. Ask for a diagram, flowchart, visual summary, or illustration and the agent creates it and saves it to your project's data room. Generated images appear inline in the conversation and are available for download or use in other outputs.
You can also provide reference images to guide generation. Mention a document in your project's data room as a visual reference and the agent will use it as a starting point — useful for style matching, editing existing visuals, or building on a sketch.
Using agents effectively
- Pick the right chat mode. Use Quick mode for fast lookups that don't need a full output. Use Research mode (the default) for structured outputs. Use Plan mode for complex, multi-step work — the AI proposes a plan before executing.
- Request multiple outputs at once. Agents run in parallel, so you can ask for a report and a comparison table in the same message.
- Let sub-agents do the work. The report agent can start chart and table sub-agents automatically — you don't need to request them separately.
- Iterate in the same chat. Follow up with refinements and the agent retains the full context.
- Use templates to standardize output. Attach a template and the agent will match its structure and formatting. See Templates for details.
Version history
Document outputs are tracked with append-only versioning. Each time an output is revised — whether by an agent, a user edit, or a restore action — a new version is created. Prior versions are never deleted.
Click the version history icon on any document output to browse all versions. Each entry shows who made the change and when. Click any version to preview it, then choose Restore this version to roll back — this creates a new version so the full history is preserved.
Version history is available for all output types that support editing or iteration, including reports, documents, spreadsheets, presentations, and tables.
Exporting
Click the export button on any output to download it. Available formats by output type:
| Output | Formats |
|---|---|
| Reports | Word (.docx), PDF |
| Documents | Word (.docx), Markdown (.md), Text (.txt), JSON (.json), PDF (.pdf), PNG, JPEG, WEBP |
| Presentations | PowerPoint (.pptx), PDF |
| Spreadsheets | Excel (.xlsx, .xlsm, .xls), CSV (.csv) |
| Charts | PNG |
| Grids | Excel (.xlsx) |
| Tables | Excel (.xlsx) |
To export all grids or tables from a chat at once, use the Export all option to get a combined workbook with one sheet per item.